


While working as a front-end developer for last 4+ years, one thing I have witnessed junior developers constantly struggle with is proper debugging skills. I believe debugging is a skill and developers who are good at it can bring immense value. As with any other skill, one can learn debugging. All one needs to understand the tools at one’s disposal to debug React app.
This little handy guide is not only about debugging React apps, but any JavaScript based app. Some principles here are generic to programming while the others are targeted towards debugging JavaScript applications.
Re-read the error messages
Old lady reading meme
Debugging is no rocket science. Sometimes developers just panic and what could have been resolved within 5 minutes, take 30. I say this because I have spent 30 minutes.
The maintainers of programming language, library and frameworks have worked hard to make error messages self explanatory. Therefore, when you debug, the very first step is to read the error message and then re-read it.
I want to lay emphasis on re-reading the error message because usually the solution is screaming at you. Skimming through the error message is not what you should do. Read it. Slowly. Understand it and then move forward.
The error message lays out the entire call-stack. How the error bubbled up and at which line number the error was thrown, everything is out there. Going through the error call-stack will help you analyze the code flow and warnings. Reading and making sense of the error call-stack is an essential skill a developer must work on as it can help one work with legacy code-bases which are an amalgamation of hundreds of files and thousands of lines of code!
For example, if we have a button element which calls a function showAlert but we forget to define such a function, the app will throw an error.
React is kind enough to show the error at two places:
The dev-tools
The console of the dev-tools of all the browsers will show this error.
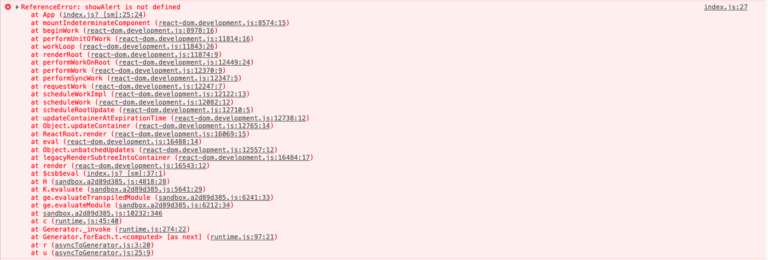
React throwing error in dev-tools console
The web page
React ensures that the error is more human readable on the web-page. You can clearly see below where the error was thrown and hence this will be the starting point to debug React app.
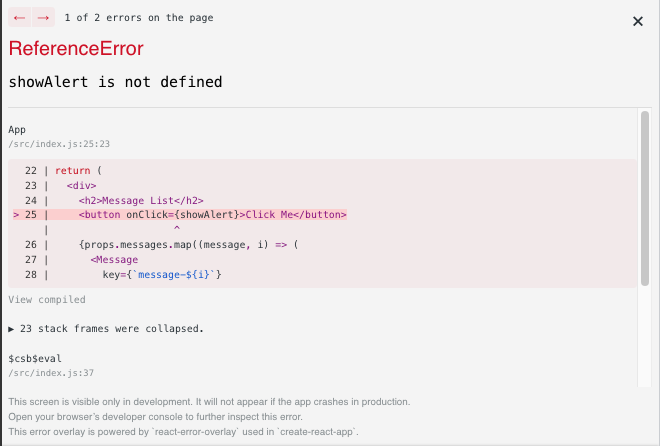
React error message on the web-page
I cannot stress enough on how important it is to read and then re-read the error message. You need to understand it completely before you even start exploring Stack Overflow and Google.
One thing that I have experienced is that Google is pretty good at its job as a search engine. It will give you back the results for the question you asked. Now if you have mis-understood the error and are trying to ask Google wrong questions, it will give you answers which will take you down the rabbit hole of copy-pasting different solutions until something works!
Learn to use your IDE

Queen Elizabeth II insists on cutting cake with a sword at G7 event
Today, Integrated Development Environments (IDE) are very powerful. They hint you what’s wrong right in your code, even before you Save it. Not understanding the tools you have slows you down and makes you inefficient at your job. Understanding how your IDE works is so important that programmers and content creators out there have created full fledged courses on the very topic. Some of my favourites around VS Code are:
You can use VS Code extensions/plugins for effective debugging as well. For JavaScript, plugins like ESLint by Microsoft are a must. If you want your project to ship with an ES Lint, then you can do that as well by using a NPM library.
If you find yourself relying too much on plugins and external NPM libraries, please remember this:
To a man with a hammer, everything looks like a nail.
– Mark Twain
React apps with proper ESLinting and IDE, will even fail to compile, eventually throwing the error in the terminal:
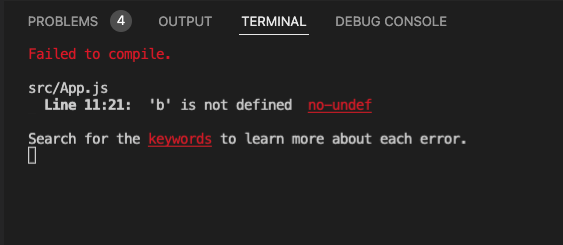
React app failing to compile due to undefined variable
Working with Breakpoints
This is one of the most helpful and yet one of the most under-utilized piece of debugging tool developers use. In software development, a breakpoint is an intentional stopping or pausing place in a program which is added to debug the code. One can work with breakpoints in multiple ways, but the two most prominent are:
- Breakpoints via Dev Tools in the browser
- Using the debugger in the IDE like VSCode
Breakpoints via Dev Tools in the browser
Open the Chrome dev tools. I am using Google Chrome as my primary browser, but dev tools are present in all browsers. Go to Sources. Go to the Page tab and the localhost:3000 dropdown. There you’ll see all your files and you can add debuggers to your JS files right then and there.

Location of all the files of your app in dev tools
Here, I’ll be adding a breakpoint on the testDebugger function, just before it consoles the value of the variable a. As soon as you click the button, it will stop the execution of the app on the very breakpoint. You can then use the panel of buttons on the top-right corner (in Red box) to move around the function.
For a more detailed tutorial, you can refer Debugging JavaScript — Chrome DevTools 101.
If you look closely below, you’ll be able to see all the breakpoints, the call stack and the file on the left panel.
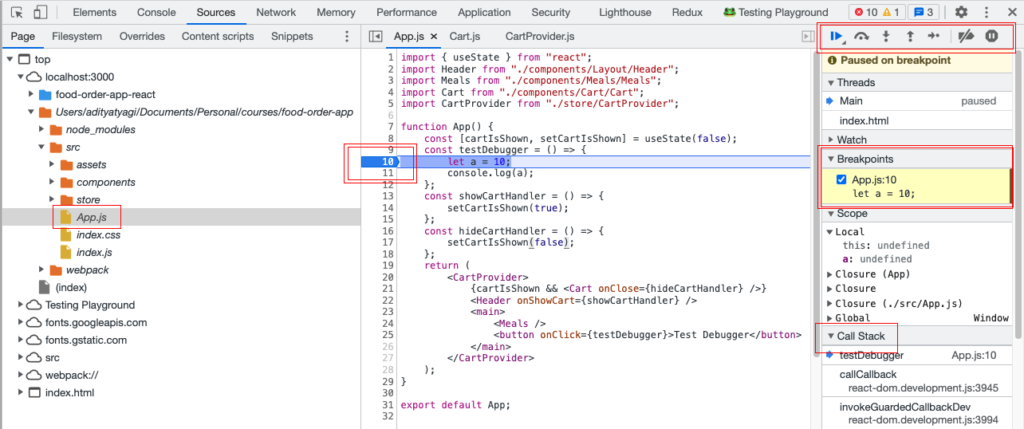
Debugger in Chrome Dev Tools to debug React app
Using the debugger in the IDE like VSCode
Today the IDEs come with in-built debuggers. You do not have to rely on the dev tools in the browser. The workings of the VSCode debugger is similar to debugger in dev tools. To understand it, you can refer the following two resources:
- The New Way To Debug JavaScript in VS Code — No Extension Required
- How to Use a Debugger — Debugger Tutorial
This is how the debugger will look like in the VSCode:
- Yellow: Debugger
- Blue: The breakpoint
- Pink: List of all breakpoints
- Red: Variables
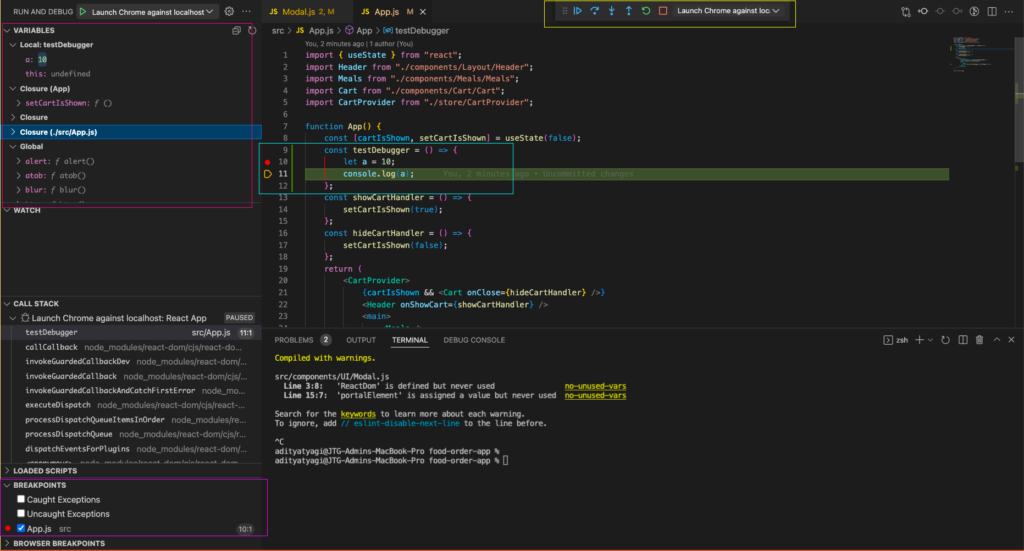
VSCode Debugger in action
React Developer Tools
React Developer Tools is a browser extension that helps to debug React apps. It is present in other browsers as well, but I’ll recommend you to get comfortable with the Chrome extension. This extension makes the process to debug React app easy and consistent!
From the official docs:
React Developer Tools is a Chrome DevTools extension for the open-source React JavaScript library. It allows you to inspect the React component hierarchies in the Chrome Developer Tools.
Once you enable this extension, you’ll see two new additions to your dev tools:
- Components
- Profiler
The Components will show only React components and not the entire DOM like the Elements tab shows.
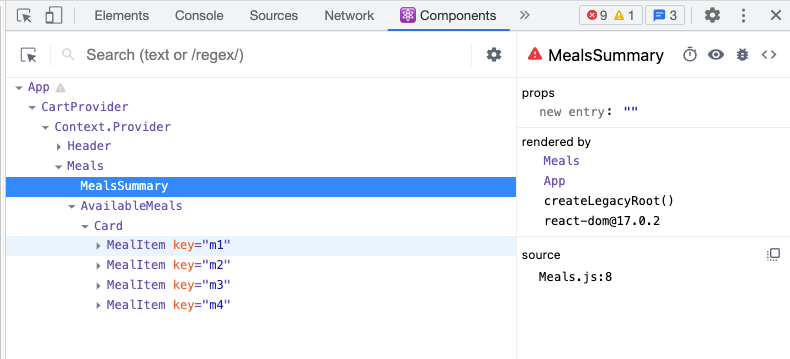
Demo of React Dev Tools chrome extension
You can learn here with examples:
Reach out for help!

Baby Yoda Meme
Sometimes the error message is cryptic or we cannot make sense of it. Even after struggling to find a working solution, trying everything from Stack Overflow and doubting your entire life, you aren’t able to debug. In such cases, pause. Take a deep breath and ask for help!
If you are a junior developer working in a company, then reach out to the senior developers. Sometimes all you need is a fresh perspective to the whole situation. If you are a self-taught developer and are building something all by yourself (kudos to you!), reach out to the very welcoming developer community on Twitter and Discord. The community, combined with this one skill can help you debug any bug!
Few developers know, the programming community on Discord is amazing! All you have to do is ask the relevant question in the relevant channel and you’ll get the solution. If not, the solution, there will be 1 kind soul to help you move forward with your quest to debug React app.
Some of the Discord communities I follow:
If you are still stuck, call it a day. Sleep on it and tackle it with a fresh mind the next day. You’ll be surprised how often the answers are just in front of us.
Thank you for your time. I hope I was able to bring value.
I’m reachable on some social media channels, so consider checking me on: